NewWindows Autopilot device association is generally available

Windows Autopilot monitoring

See every Autopilot enrollment. Live.

Real-time monitoring, automated root-cause analysis, and evidence that survives a device reset — deployed once via Intune, live minutes later.

Free & open source · no infrastructure on your side

User-drivenPre-provisioningSelf-deployingDevice PreparationDevice associationWindows 365Entra ID & Hybrid join
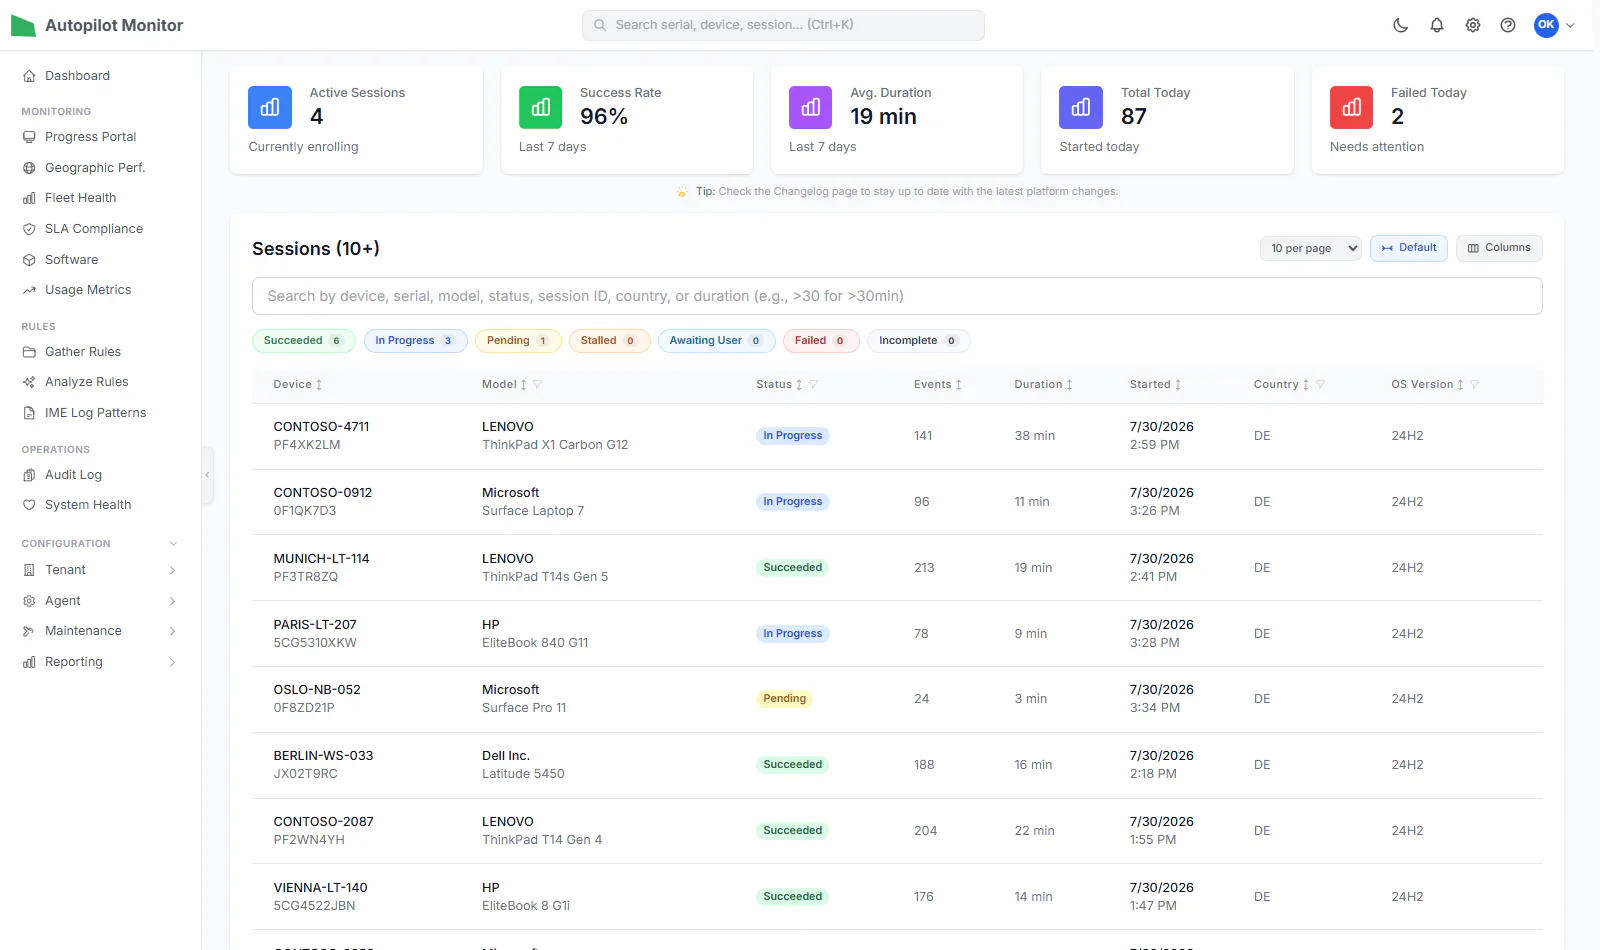
Autopilot Monitor dashboard with live enrollment sessions

27,241

enrollments monitored

46,210

issues detected

352

organisations

581

device models

9.0M

events processed

Evidence first

Never debug the same failure twice.

Every enrollment is recorded while it runs, so the evidence is still there after someone resets the device. Known problems are flagged by analyze rules. Unknown ones you investigate with your AI assistant — and what you find becomes a rule that catches the next one.

The first failure becomes evidence. The next one is a known problem.

How the AI digs in
  1. 1 · Captureagent

    Phases, apps, errors and timings stream in while the device enrolls. With diagnostics upload on, failed enrollments also keep their IME and agent logs.

  2. 2 · Detectanalyze rules

    Built-in, community and your own analyze rules name known problems as they happen.

  3. 3 · InvestigateMCP

    No rule fits? Your AI assistant reads the session through MCP. Clients that work with files, such as Claude Code, go on into the raw IME logs.

  4. 4 · Learnnew rule

    The assistant drafts a rule and dry-runs it against your sessions. A Tenant Admin switches it on, or submits it to the community pool.

  5. Next time: detected automatically

Built-in MCP server

Then just ask.

Your AI assistant reads the whole session for you, finds the root cause a human would dig for all afternoon, and writes the rule that catches it next time. This analysis is real.

See what else you can ask
AI assistant — connected to Autopilot Monitor MCP
❯

The story

Follow one enrollment.

This is a normal Tuesday with Autopilot Monitor — told the way you'd actually live it.

09:02

A device powers on somewhere.

A new hire unboxes their laptop three time zones away. The bootstrapper you assigned once in Intune kicks in, and the enrollment appears on your dashboard — live.

Every phase, every app install, every reboot streams in as it happens. No remote session, no guessing, no “can you send a photo of the screen?”

Sessions1 new
CONTOSO-4711Enrolling
ThinkPad X1 Carbon G12·User-driven·Berlin, DE

09:02:14 phase_transition Device Preparation started

09:02:31 enrollment_type_detected User-driven deployment

No remote session. No guessing.Live ↗
09:41

Something's wrong.

Device Setup has been running for 39 minutes. Without monitoring, this is where you stare at a frozen ESP spinner and start guessing.

Instead, an analyze rule fires and names the stuck app — before anyone opens a ticket. 40+ built-in rules, community-driven and fully customizable.

Analysis — CONTOSO-47111 issue detected
HighANALYZE-ESP-001

ESP Blocking App Timeout

Confidence:
80%

Device Setup has been running for 39 minutes — a blocking app is stuck, downloading very slowly, or in a retry loop.

Contoso VPN Clientstalled · 23 min
download_progress · 87%no progress since 09:18

Suggested remediation

  • Identify the blocking app (done — see above)
  • Verify the app content is downloadable
  • Consider reducing the number of blocking apps
09:42

You knew before anyone called.

The moment the rule fired, it pinged your team — Teams or webhook, your choice. No dashboard-watching required.

And instead of asking the user to hunt for logs, one click pulls the complete diagnostics package straight from the device while it's still enrolling. By the time anyone would have opened a ticket, you're already reading the evidence.

Teams · #intune-ops09:41
HighESP Blocking App Timeout

CONTOSO-4711 — Device Setup running 39 min, blocking app Contoso VPN Client stalled at 87%.

Open session
Diagnostics — CONTOSO-4711ZIP ready
  • Requested from the portal09:42:10
  • Collected on the device — mid-enrollment09:43:05
  • Uploaded · 14.2 MB09:43:41
CONTOSO-4711_diagnostics.zipDownload
Later

Now multiply by 500.

One device is a story. Five hundred are a pattern. Fleet health shows success rates, duration trends, and which app or hardware model is quietly costing you the most.

The VPN client from this morning? It's in 62% of your slow enrollments. Now you know what to fix first — with data, not anecdotes.

Fleet Health — last 7 days3 enrolling now

94.6%

Success rate

22 min

Avg. duration

213

Enrollments

Mon
Tue
Wed
Thu
Fri
Sat
Sun

Hotspots across the fleet

  • Contoso VPN Clientin 62% of slow enrollments
  • ThinkPad X1 Carbon G12avg 21 min · 97% success
  • Surface Laptop 7avg 18 min · 99% success

Capabilities

Everything the story just showed you — and more.

Real-time event stream

Live phase tracking with push updates, from first boot to desktop.

Analyze rules

Built-in, community-driven, and fully customizable issue detection.

Gather rules

Capture registry keys, files, or WMI data on any event you choose.

On-demand diagnostics

Pull a diagnostics package from any enrolled device — no ticket ping-pong.

Event timeline

Per-session drill-down with app installs, errors, and IME insights.

Fleet health & trends

Success rates, duration trends, model and app hotspots at a glance.

Notifications

Teams and webhook alerts the moment an enrollment fails or stalls.

MCP server for AI

Ask about sessions and the fleet, dig into diagnostics, draft new rules.

Audit log & open source

Full audit trail — and the whole platform is open on GitHub.

Compare

Standard Autopilot vs. monitored Autopilot

What you're missing without Autopilot Monitor — and what you gain the moment you deploy it.

Deployment visibility
Real-time phase tracking with live push updates
None — black box until it finishes or fails
Download progress
Per-app download speed, bytes transferred, % complete
No visibility into what's downloading or how long it takes
User-facing progress page
Progress view with live app status & download info
Generic ESP screen — no details for the end user
Fleet health dashboard
Success rates, failure trends, avg. duration across all devices
Limited manual report extraction from Intune
Analyze rules
Built-in + fully customizable rules for automated issue detection
Manual log review required after every failed deployment
Extended data gathering
Custom gather rules to capture registry, files, or WMI on any event
No automated data collection during enrollment
Geo & network context
Device location, and network info captured at enrollment start
No location or network context in deployment records
Performance monitoring
CPU, memory, disk, and network snapshots during deployment
Not captured — no way to detect resource bottlenecks
Troubleshooting speed
Drill into per-event timeline, IME log patterns, and analyze results
Manual IME log hunting — slow and error-prone
Unknown failures
Evidence already saved — investigate it with AI, then turn the finding into a rule
Reproduce the failure and collect the logs again

How it works

Live in three steps. No infrastructure on your side.

1

Sign in & grant access

Authenticate with Microsoft and approve tenant access once.

2

Deploy the bootstrapper via Intune

Assign one PowerShell script to your Autopilot scope. That's the whole rollout.

3

Watch your first enrollment live

Phases, apps, failures, and diagnostics stream in minutes later.

From the field

What endpoint teams see on day one.

Wow — for the first time I can actually see all of our enrollments running out there.
Head of Endpoint Management

Seeing the same in your tenant? Leave a star.

Star on GitHub70

Your next enrollment doesn't have to be a black box.

Start monitoring now

Free, open source, deployed in minutes.Need SLAs, support, or MSP delegation? There's a Pro plan.